
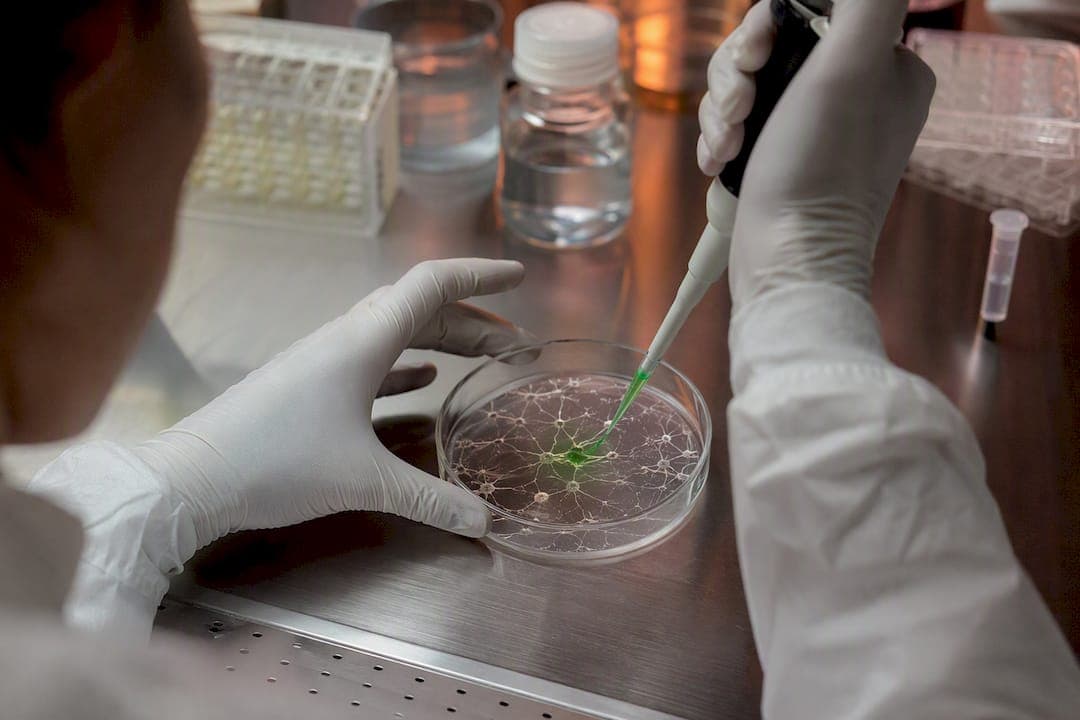
For iPSC-derived neuronal models, pair steady-state imaging with a flux readout and a mitochondrial profile: LC3 immunofluorescence + a tandem or luminescent flux reporter + Seahorse XFe96 bioenergetics. No single assay separates autophagosome formation from blocked turnover, and mitophagy needs its own mitochondria-selective reporter to avoid conflating it with bulk autophagy.
Combinations matter because raw LC3 puncta counts are ambiguous. More puncta can mean more autophagosomes forming, or it can mean autophagosomes piling up because lysosomal fusion stalled. Only a flux experiment, ideally with lysosomal blockade, tells you which.
- Use Torin as your positive inducer and Bafilomycin A1 to block lysosomal degradation, always as paired conditions, never alone.
- Gate on a neuronal marker like Tubulin β3 so you are not averaging signal across undifferentiated cells or glia.
- Run a Seahorse mitochondrial profile alongside any mitophagy reporter to confirm the effect is mitochondria-specific.
Pro Tip: Always run the inducer-plus-blocker condition side by side with inducer-alone. That single comparison tells you more about where the pathway is stuck than any other data point in the experiment.
Key Takeaways
Reliable autophagy and mitophagy measurement in iPSC models requires combining steady-state imaging, a flux assay, and an orthogonal mitochondrial readout rather than relying on any single method.
| Point | Details |
|---|---|
| Never trust puncta alone | Pair LC3 immunofluorescence with a lysosomal blocker like Bafilomycin A1 to confirm flux, not just formation. |
| Gate on neuronal identity | Use Tubulin β3 with Hoechst nuclear staining to segment neurons before quantifying LC3 puncta. |
| Confirm mitophagy specifically | Combine mt-mKeima or tandem mitochondrial reporters with a Seahorse XFe96 profile to rule out general autophagy. |
| Use replicates and isogenic controls | Run at least three biological replicates and a CRISPR-corrected isogenic line wherever feasible. |
| Consider a turnkey pipeline | Hopeatrarelabs runs patient-derived iPSC autophagy and mitochondrial profiling alongside parallel drug and ASO screening. |
Primary Protocols and Vendor Resources Worth Bookmarking
For hands-on protocol detail beyond this guide, start with the high-content autophagy immunofluorescence method for iPSC neurons and the Seahorse XFe96 protocol review for bioenergetics setup.
- The UCL draft protocol for step-by-step CellProfiler segmentation parameters.
- The Renilla luciferase flux reporter methods paper for luminescent reporter design.
- Promega's LC3 autophagy assay page for HiBiT reagent manuals and ordering.
- The eLife HaloTag flux reporter paper for pulse-chase assay design.
Table of Contents
- Why iPSC-Derived Models Need Different Assay Design
- Which Autophagy and Mitophagy Assays Should You Choose?
- Immunofluorescence and HCS Protocol Essentials for iPSC Neurons
- How Do You Design and Interpret an Autophagy Flux Assay?
- Setting Up Microscopy and CellProfiler Analysis for LC3 Puncta
- Measuring Mitophagy and Mitochondrial Function Without Guessing
- Building a Reproducible Assay Pipeline for Your Research Goal
- Common Pitfalls in iPSC Autophagy Measurement
- Get Turnkey Autophagy and Mitophagy Profiling Without Building the Pipeline Yourself
- Frequently Asked Questions
- Sources
Why iPSC-Derived Models Need Different Assay Design
Immortalized cell lines are forgiving. iPSC-derived neurons are not. Clonal heterogeneity, extended neurite architecture, and autophagosome trafficking that has to travel the length of an axon before reaching a lysosome all change how sensitive an assay needs to be. Mature neurons also tend to silence viral promoters over time, which quietly kills reporter expression in exactly the cultures you have invested weeks into differentiating.
That heterogeneity has practical fallout: neurites are more fixation-sensitive than cell bodies, you lose an imaging channel to a mandatory neuronal marker, and lentiviral transduction efficiency in post-mitotic neurons runs lower than in dividing lines.
Every autophagy experiment in an iPSC model needs four things: a positive inducer, a lysosomal blocker, a vehicle control, and, wherever feasible, a CRISPR-edited isogenic control line. Skip the isogenic comparison and you risk mistaking clone-to-clone variability for a disease phenotype.
Pro Tip: Bank a lipidation-deficient reporter control (like Rluc-LC3-G120A) alongside your working construct from the start. It is the cheapest insurance against chasing a signal that turns out to be nonspecific.
Which Autophagy and Mitophagy Assays Should You Choose?
Assessing autophagy in iPSCs comes down to matching the assay to the question: are you screening thousands of compounds, or trying to pin down a mechanism in a handful of patient lines?
Immunofluorescence LC3 puncta counting gives you a steady-state snapshot. It is cheap, scales to high-content platforms, and works well in fixed iPSC neurons, but on its own it cannot distinguish increased formation from blocked clearance, per the guidelines for monitoring autophagy assays.
LC3-II western blotting remains the classic orthogonal check, though the lipidated form famously runs faster than LC3-I on SDS-PAGE due to added hydrophobicity, a quirk that trips up a lot of first-time analysts during band assignment.
Tandem fluorescent reporters (mCherry-GFP LC3) exploit GFP quenching in acidic lysosomes, so a shifting yellow-to-red ratio tracks flux directly, and mt-mKeima does the same trick for mitochondria specifically, as detailed in a review of tandem and mt-mKeima reporters.
Luminescent reporters like Rluc-LC3 and the Promega LC3 HiBiT system, plus HaloTag processing assays, suit high-throughput screening where imaging every well is impractical.
Seahorse XFe96 extracellular flux analysis rounds out the panel, giving you OCR and ECAR as an independent, functional readout of mitochondrial health.
Immunofluorescence and HCS Protocol Essentials for iPSC Neurons
Fixation choice matters more than most first drafts of a protocol admit. Methanol fixation improves some antibody epitope access but can shred fine neurite structures; a 4% paraformaldehyde fix at room temperature generally preserves neuronal morphology better and is the safer default for LC3 puncta work.
Antibody selection should be validated, not assumed. A commonly cited panel uses LC3B (Sigma L7543), Tubulin β3 (BioLegend 801201) as the neuronal marker, and Alexa Fluor secondaries (ThermoFisher A11034 for rabbit, A11031 for mouse), paired with a low-concentration Hoechst nuclear stain for segmentation, following the approach described in high-content immunofluorescence workflows for iPSC-derived neurons.
Every plate needs Torin, Bafilomycin A1, Torin plus Bafilomycin A1, and DMSO vehicle, run in the same imaging session so illumination and exposure stay comparable across conditions, a design echoed in the UCL high-content autophagy protocol.
| Parameter | Recommended starting point |
|---|---|
| Fixation | 4% paraformaldehyde at room temperature |
| LC3B antibody | Sigma L7543, validate dilution per lot |
| Neuronal marker | Tubulin β3, BioLegend 801201 |
| Secondary antibodies | Alexa Fluor A11034 / A11031, ThermoFisher |
| Nuclear stain | Hoechst, low working concentration |
| Fields imaged per well | Multiple, avoid single-field sampling |
Pro Tip: Check your histogram before you move to the next plate. A camera creeping toward saturation on LC3 puncta will silently flatten your dynamic range and make treated and control wells look more alike than they are.
How Do You Design and Interpret an Autophagy Flux Assay?
Autophagic flux measurement is the piece that separates a rigorous iPSC autophagy analysis from a cosmetic one. Steady-state LC3 puncta only tell you what is present at one moment; flux tells you whether material is actually moving through the pathway.
- Western blot format: run LC3-II with and without a lysosomal inhibitor. A bigger jump in LC3-II under blockade means active turnover; no jump suggests the pathway was already stalled.
- Tandem reporter format: quantify the mCherry-only (red) versus dual-color (yellow) puncta ratio. A rising red-only fraction over time indicates active lysosomal delivery.
- Luminescent reporter format: use Rluc-LC3 or a HiBiT-tagged construct for continuous or high-throughput readouts, always benchmarked against a lipidation-deficient control, as methods work on Rluc-LC3 reporters demonstrates.
Keep inhibitor exposure short. Prolonged Bafilomycin A1 treatment beyond the minimum effective window can trigger secondary toxicity or push cells toward alternate degradation routes, muddying the very flux signal you are trying to isolate.
Pro Tip: If Torin alone raises puncta but Torin plus Bafilomycin A1 raises them further, the pathway is intact and flowing. If the two conditions look nearly identical, something downstream of formation is already broken.
Setting Up Microscopy and CellProfiler Analysis for LC3 Puncta
Consistent imaging beats clever imaging. Fix a single objective, exposure time, and z-plane strategy across a plate, and capture several sites per well rather than trusting one field to represent the culture.
A typical CellProfiler pipeline for iPSC neurons runs IdentifyPrimaryObjects on the Hoechst channel to call nuclei, then IdentifySecondaryObjects on Tubulin β3 to define neuronal cytoplasm, filters out non-neuronal cells, and finally segments LC3 puncta within that neuronal mask, measuring count, area, and intensity metrics including upper quartile intensity and standard deviation.
Normalize puncta counts to cell number or neuronal area per well, and flag wells for quality control using cell count, percent-neuronal fraction, and saturation warnings before they enter statistical analysis.
| Output metric | What it captures |
|---|---|
| Puncta count per neuron | Autophagosome abundance, normalized |
| Puncta area fraction | Proportion of cytoplasm occupied by LC3 signal |
| Mean puncta intensity | Signal strength per autophagosome |
| TMRM intensity | Mitochondrial membrane potential |
| Viability marker signal | Confounder check for toxicity |
Measuring Mitophagy and Mitochondrial Function Without Guessing
Mitophagy assays in iPSCs need a mitochondria-specific reporter, because general autophagy readouts cannot tell you whether the cargo being cleared is actually mitochondrial. mt-mKeima solves this directly: its emission spectrum shifts on acidification, so a move toward the acidic profile signals delivery to lysosomes specifically from the mitochondrial pool.
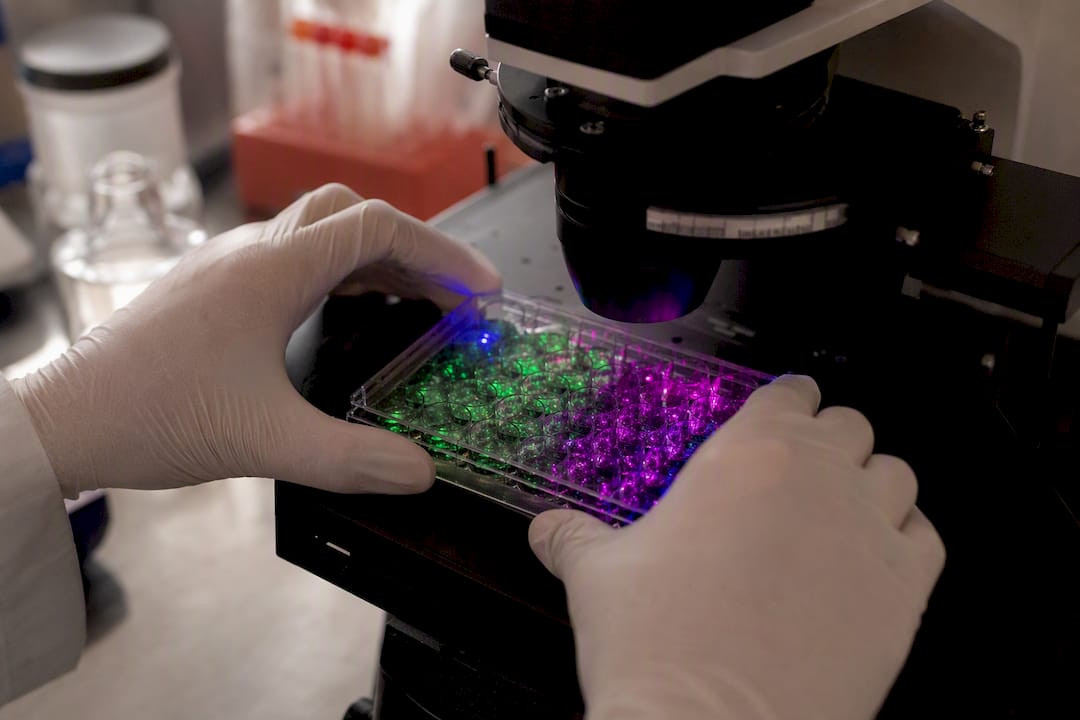
Vital dyes fill in the mechanistic picture. TMRM reports membrane potential and only labels functioning mitochondria, MitoTracker variants mark mitochondrial mass more broadly, and MitoSOX flags mitochondrial reactive oxygen species, an insight backed by research on disease-related mitochondrial phenotypes in patient iPSC models.
Seahorse XFe96 rounds out the mechanistic case. Plate iPSC-derived cells at a density validated for even monolayer coverage, then inject oligomycin in a low micromolar range, FCCP in a range near 1 micromolar, and rotenone/antimycin each in a low micromolar range, adjusting concentrations per cell line according to protocol recommendations, as outlined in protocols for Seahorse flux analysis in iPSC-derived cells.
| Injection | Typical starting concentration | Parameter revealed |
|---|---|---|
| Oligomycin | a low micromolar range | ATP-linked respiration |
| FCCP | a range near 1 micromolar | Maximal and spare respiratory capacity |
| Rotenone/antimycin | each in a low micromolar range | Non-mitochondrial respiration baseline |
A drop in mt-mKeima acidification paired with an unchanged Seahorse profile points toward general autophagy rather than mitophagy. A shift in both, together, is the stronger case for mitochondria-selective clearance.
Building a Reproducible Assay Pipeline for Your Research Goal
The right pipeline depends on what you are trying to prove. A validation study, a mechanistic deep dive, and a compound screen call for different combinations of the same core tools.
- Minimal validation pipeline: LC3 immunofluorescence puncta counting, LC3-II western blot with a lysosomal inhibitor arm, and a basic viability readout.
- Mechanistic pipeline: a tandem or luminescent flux reporter, high-content mitophagy imaging, a full Seahorse bioenergetic profile, and an isogenic CRISPR-corrected control line.
- Screening pipeline: a luminescent flux reporter or HiBiT construct as the primary readout, with high-content imaging reserved for confirming hits.
- Run at least three biological replicates from independent differentiations, not just technical replicates from one plate.
- Randomize compound and control placement across the plate to control for edge effects on outer wells.
- Apply a straightforward statistical test (t-test or ANOVA with correction for multiple comparisons) before calling a hit, and confirm any positive with an orthogonal assay format.
Screening-stage decisions like these connect directly to broader phenotype-driven drug discovery workflows, where autophagy readouts feed into a larger compound triage funnel.
Common Pitfalls in iPSC Autophagy Measurement
Most failed autophagy experiments trace back to the same handful of mistakes.
- Reading increased LC3 puncta as increased autophagy without a flux control. Add Bafilomycin A1 and a reporter before drawing that conclusion.
- Losing neurite detail to a fixation method chosen for convenience rather than morphology. Test methanol against paraformaldehyde on your specific line before committing.
- Getting inconsistent reporter signal across clones. Use clonal iPSC lines and normalize against a lipidation-deficient control construct.
- Pushing lysosomal inhibitor exposure past the effective window. Titrate exposure time first, then use the shortest duration that still gives a measurable signal.
Pro Tip: Keep a running log of which clone and passage number produced which reporter signal. Reporter silencing creeps in gradually, and without that log you will not catch it until an entire experiment is compromised.
RareLabs' Take on Building These Assays Into a Translational Pipeline
Hopeatrarelabs runs patient-derived iPSCs, CRISPR-edited isogenic controls, high-content autophagy imaging, and Seahorse profiling in parallel, not sequentially, because waiting on one readout before starting the next only delays a therapy decision. Layering these assay types against each other is also how false positives get caught before they reach a treatment recommendation.
Get Turnkey Autophagy and Mitophagy Profiling Without Building the Pipeline Yourself
Running the full stack described above, patient-derived iPSC differentiation, CRISPR isogenic controls, high-content LC3 imaging, and Seahorse bioenergetics, takes a dedicated lab months to validate from scratch. Hopeatrarelabs already runs this pipeline end to end on patient-specific models, so a family, foundation, or biopharma partner gets translational answers without first building and troubleshooting the assay infrastructure themselves.

That matters most for ultra-rare diseases, where there is no published protocol tailored to the exact mutation in front of you and no time to spend a year optimizing fixation conditions. Hopeatrarelabs pairs autophagy and mitochondrial phenotyping with parallel drug repurposing screens and ASO development, so a defect detected in an LC3 or Seahorse readout connects directly to candidate treatments rather than sitting in a slide deck. If you are weighing whether a personalized disease-modeling program makes sense for your case, visit the RareLabs knowledge page to see the full range of services and start a conversation about your specific disease.
Frequently Asked Questions
What is the best single assay for measuring autophagy in iPSC-derived neurons? There isn't one. Steady-state LC3 immunofluorescence needs to be paired with a flux assay, such as a lysosomal blockade experiment or a tandem reporter, to give a reliable answer, since guidelines for monitoring autophagy make clear that single-timepoint measures overstate certainty.
How do you distinguish mitophagy from general autophagy in iPSC models? Use a mitochondria-selective reporter like mt-mKeima or a tandem FIS1 construct, then confirm the finding with a Seahorse bioenergetic profile. A shift in both signals together supports mitophagy specifically; a shift in only one points toward bulk autophagy or an unrelated toxicity effect.
Why does LC3-II sometimes run faster than LC3-I on a western blot? The lipidated LC3-II form is more hydrophobic than LC3-I, which changes its migration on SDS-PAGE independent of its actual molecular weight, a quirk documented in standard autophagy assay guidelines.
What controls are essential in every autophagy assay iPSC experiment? Include a DMSO vehicle, Torin as a positive autophagy inducer, Bafilomycin A1 as a lysosomal blocker, and both together to parse where in the pathway an effect occurs. Add an isogenic CRISPR control where possible.

How many biological replicates does an iPSC autophagy experiment need? Plan for at least three biological replicates derived from independent differentiations, not just repeated wells from a single differentiation batch, to account for the clonal variability characteristic of iPSC culture.
Sources
- High-Content Autophagy Analysis in iPSC-Derived Neurons Using Immunofluorescence - PubMed
- Real-time extracellular flux analysis using Seahorse XFe96 for iPSC-derived cells (protocol review)
- High content autophagy analysis in iPSC-derived neurons using immunofluorescence (UCL draft/protocol)
- Renilla luciferase-based reporter assay for measuring autophagic flux (methods paper)
- HaloTag-based reporter processing assay to monitor autophagic flux (eLife, 2022)